Site Summary - your powerful SEO starting point
For every site you add to PowerSearchConsole, we will set up a Site Summary which provides all the relevant SEO insights for your site. Monitor trends for keywords, pages, site sections, devices and countries based on your own Google Search Console data. Discover at a glance how your site has performed in Google over time.
The screenshot below gives a quick impression of the Site Summary Report. Scroll down for a more elaborate walk-through.

We can offer all of these reports without actually storing your data.
Explainer Video: Site Summary
Watch the 4-minuted video where I’ll demonstrate how the Site Summary works.
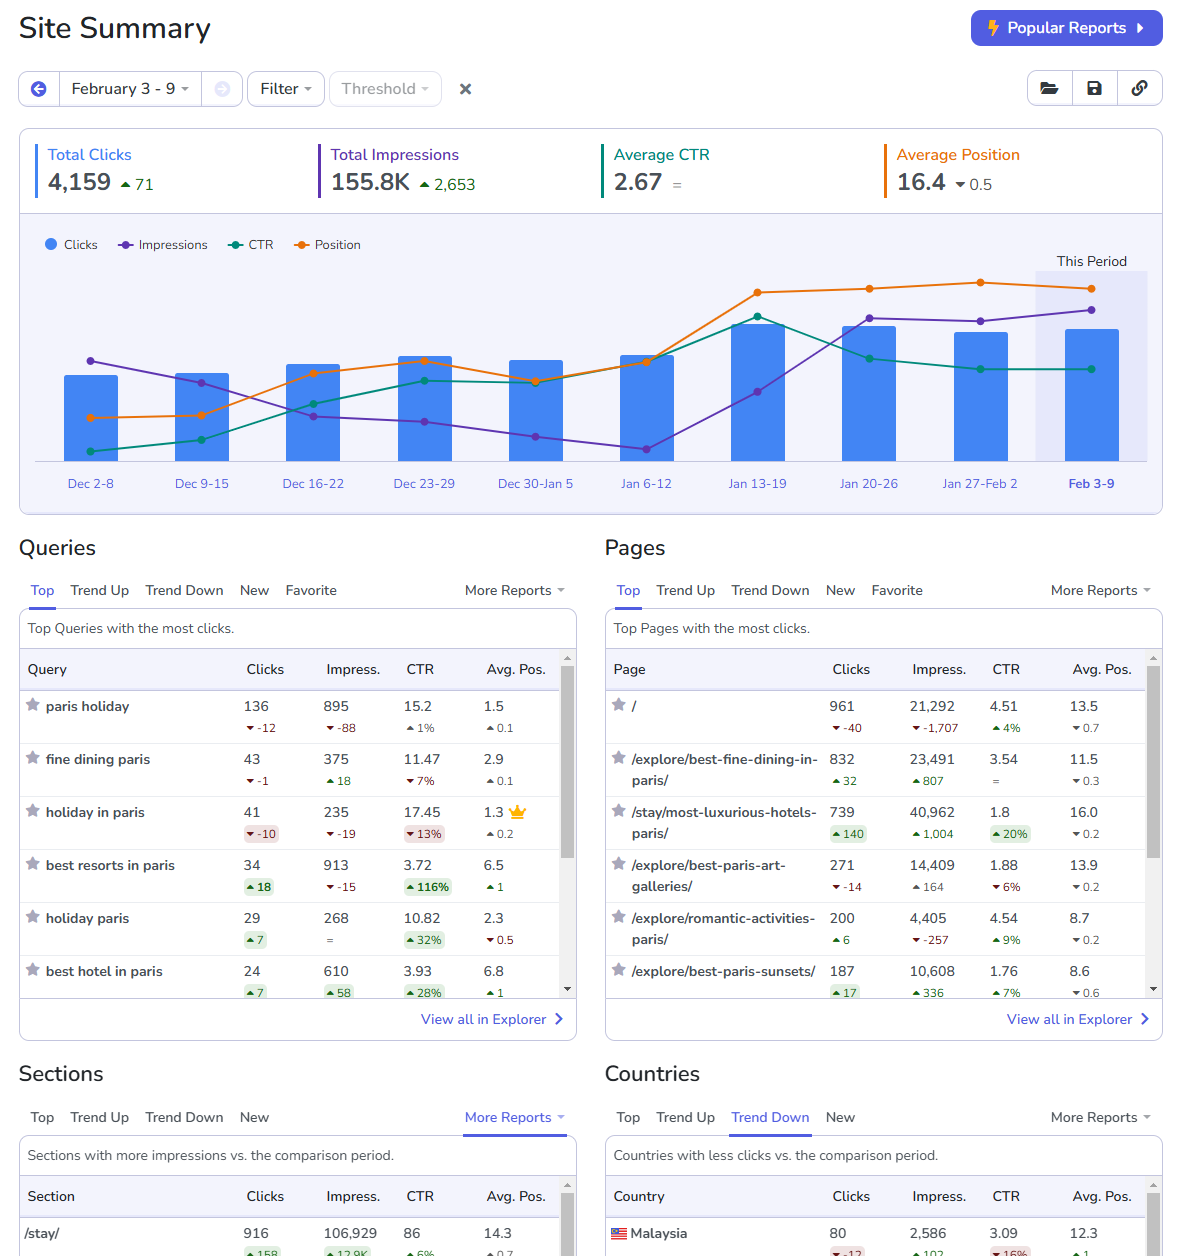
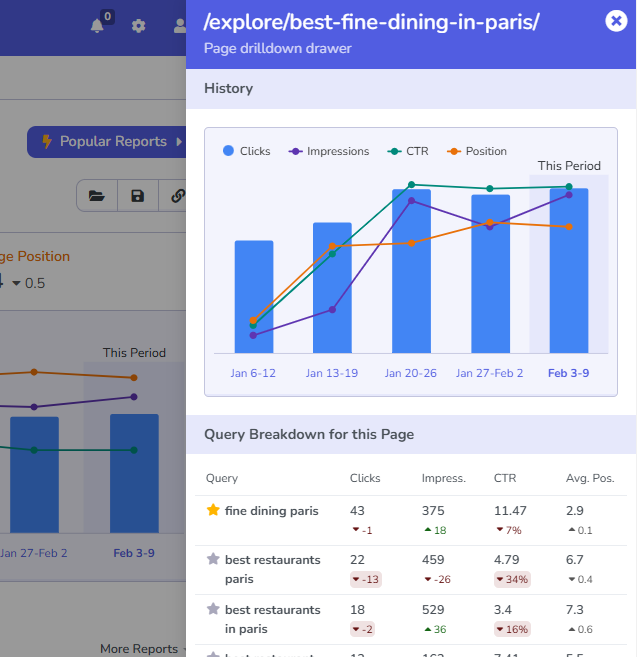
Historic Chart and Overview
Everywhere across PowerSearchConsole, whenever we show metrics, we also show trends. It is useful to see your metrics in context: are they improving or not? By default we compare against the preceding period, but you can compare against any period in the past, for example year-on-year for seasonal keywords.
PowerSearchConsole makes it easy to see the historic SEO performance of your site in a chart at a glance. While Google Search Console only offers a daily chart, we automatically display months, weeks, or periods of any size as well. When hovering a period in the chart, we show the totals and trends of that period in a handy tooltip.
By clicking on a period label in the chart, that period automatically gets applied. If you see a big drop in Impressions, just click the period and all the reports below it will center around that period, making it easy to investigate closer.
As Clicks are the core metric indicating how many organic visitors your site gets, we’ve displayed this as a Bar Chart, while all other metrics are displayed as lines just like in Google Search Console. For ease of getting used to the chart, we’ve adopted the same color scheme as GSC.

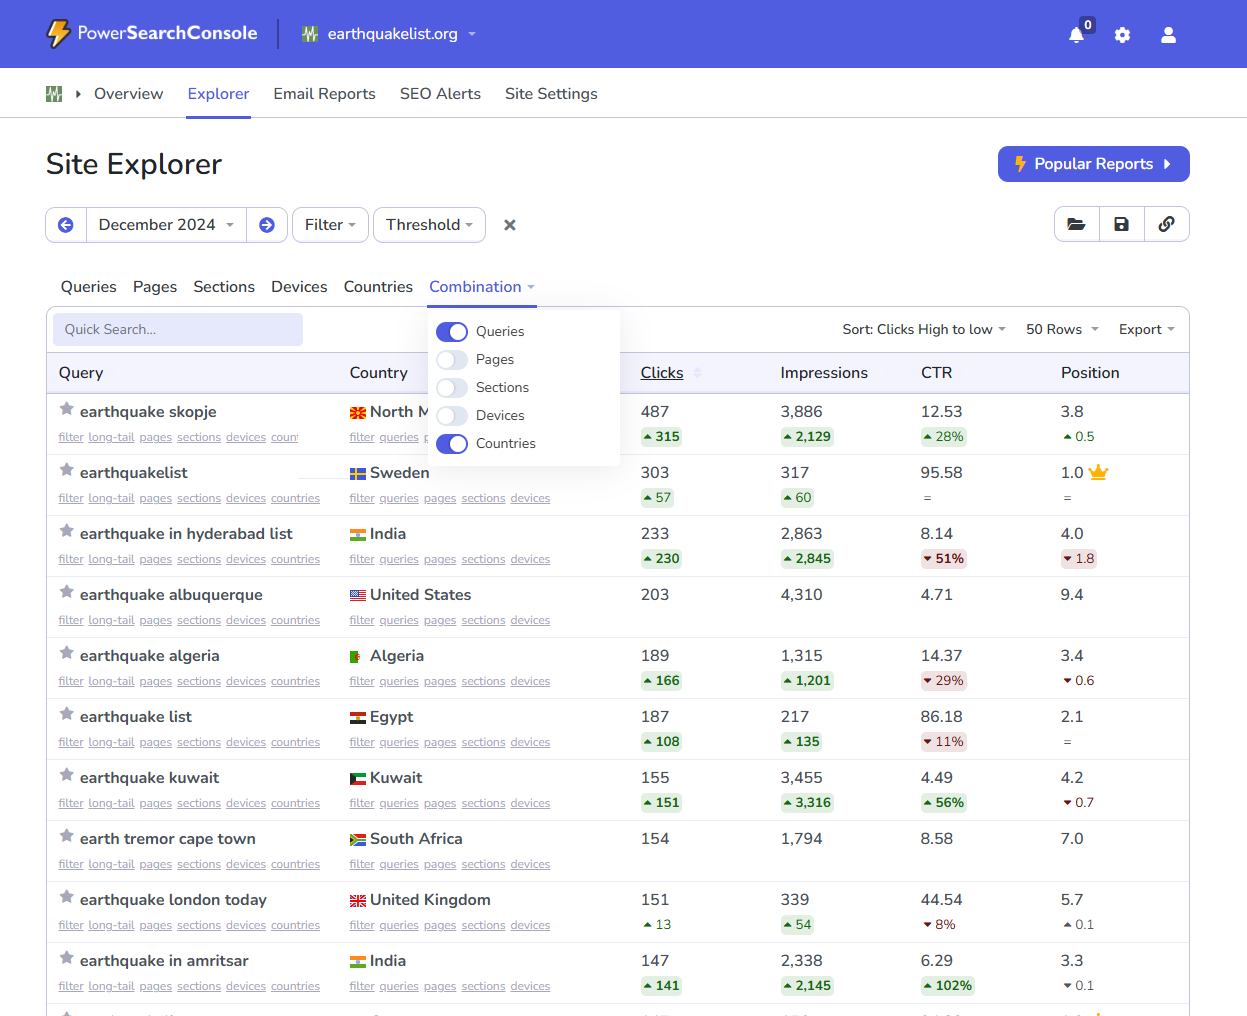
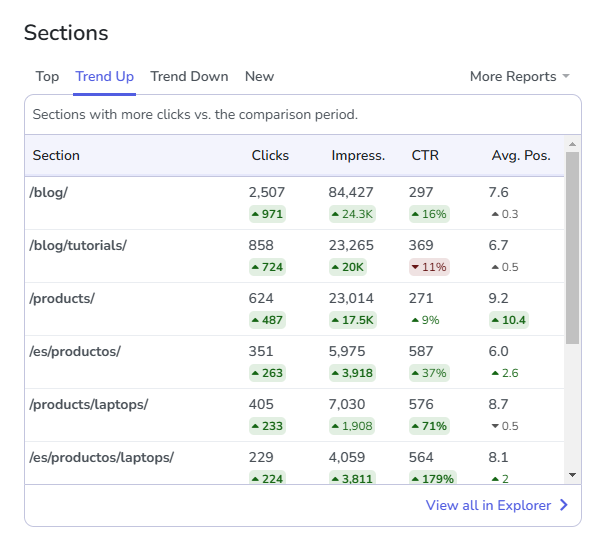
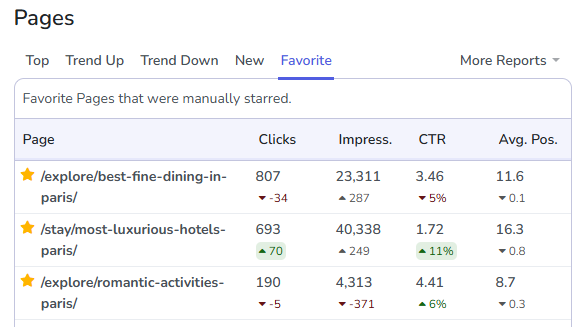
40+ Mini Reports
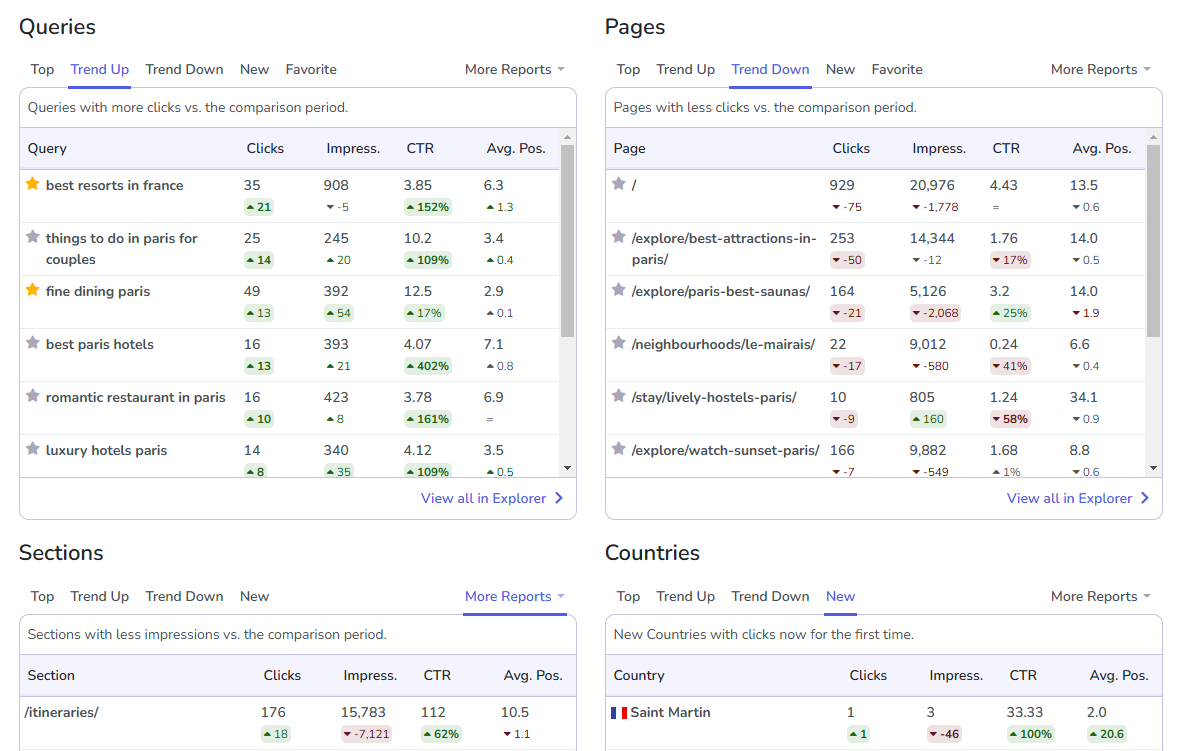
Below the chart, we show separate Mini Reports with the top queries (keywords), pages, sections, countries and devices. You can use the tabs to open up these mini reports, like Queries trending down or New Pages.

The Queries overview offers the most mini reports. Just use the More Reports dropdown on the right side to see all available mini reports.
Some examples:
- New queries
- Favorited queries (read more)
- Queries trending up or down
- Queries ranking in postion 1, top 3 or top 10
- Queries that lost a certain position
- Queries that gained a certain position

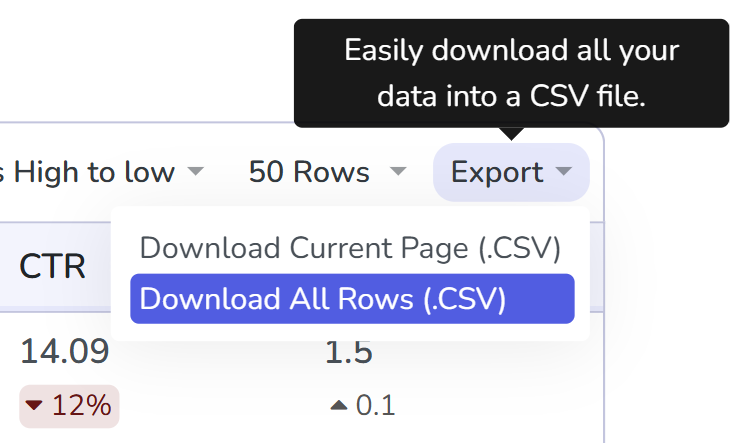
See more than 10 rows of data
PowerSearchConsole will only show the first 10 queries, pages, sections, countries or devices within a mini report. But there might be thousands of records! Click the “View All” link under your mini report and you’ll be taken to the Data Explorer where you can see the full report.
Apply Filters
Filtering is a powerful feature of the Site Summary, as it allows you to apply filters to all the mini reports as well as the historic chart.
For example, by applying a URL filter for the /blog/ section of your site, you can immediately see how your blog is performing for different keywords, pages, devices and countries.
Get started for free
You have to try it for yourself to understand the power! Use the Site Summary Report immediately by signing up for a free 7-day trial, no credit card required. If your site does not get a lot of traffic from Google yet, you can even continue using the Site Summary report and other PowerSearchConsole features within the free plan after your trial is over.
What is PowerSearchConsole?
PowerSearchConsole is the best reporting tool for your Google Search Console data. Read more on the ways it can help you here.